 PhenoRoam

Type of resources
Keywords
Contact for the resource
Provided by
-
µCt images with a resolution of 11µm
-
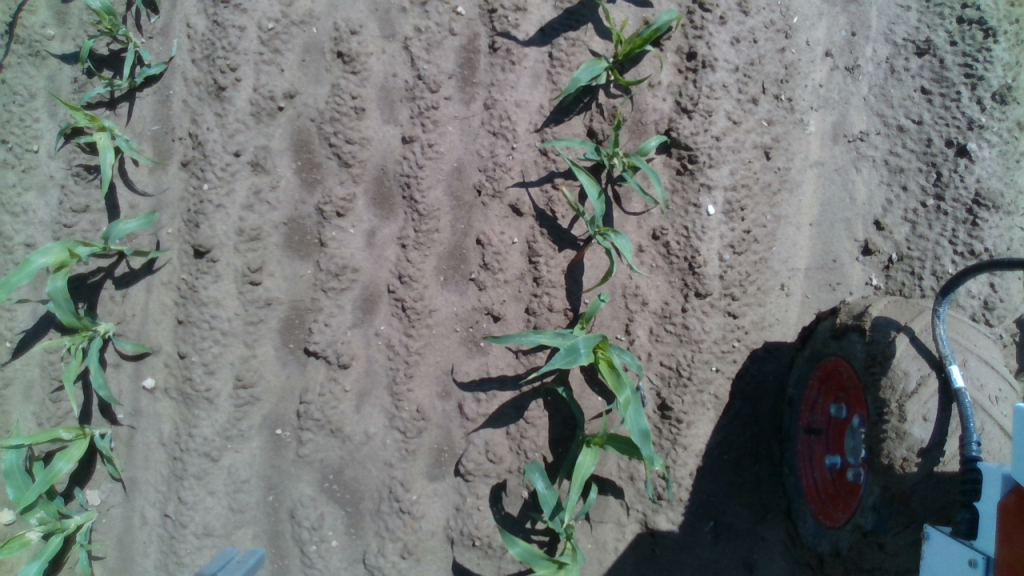
The corn Dataset (CN20) was captured using BonnBot-I. This is a challenging dataset for crop monitoring approaches as it is a grass crop.
-
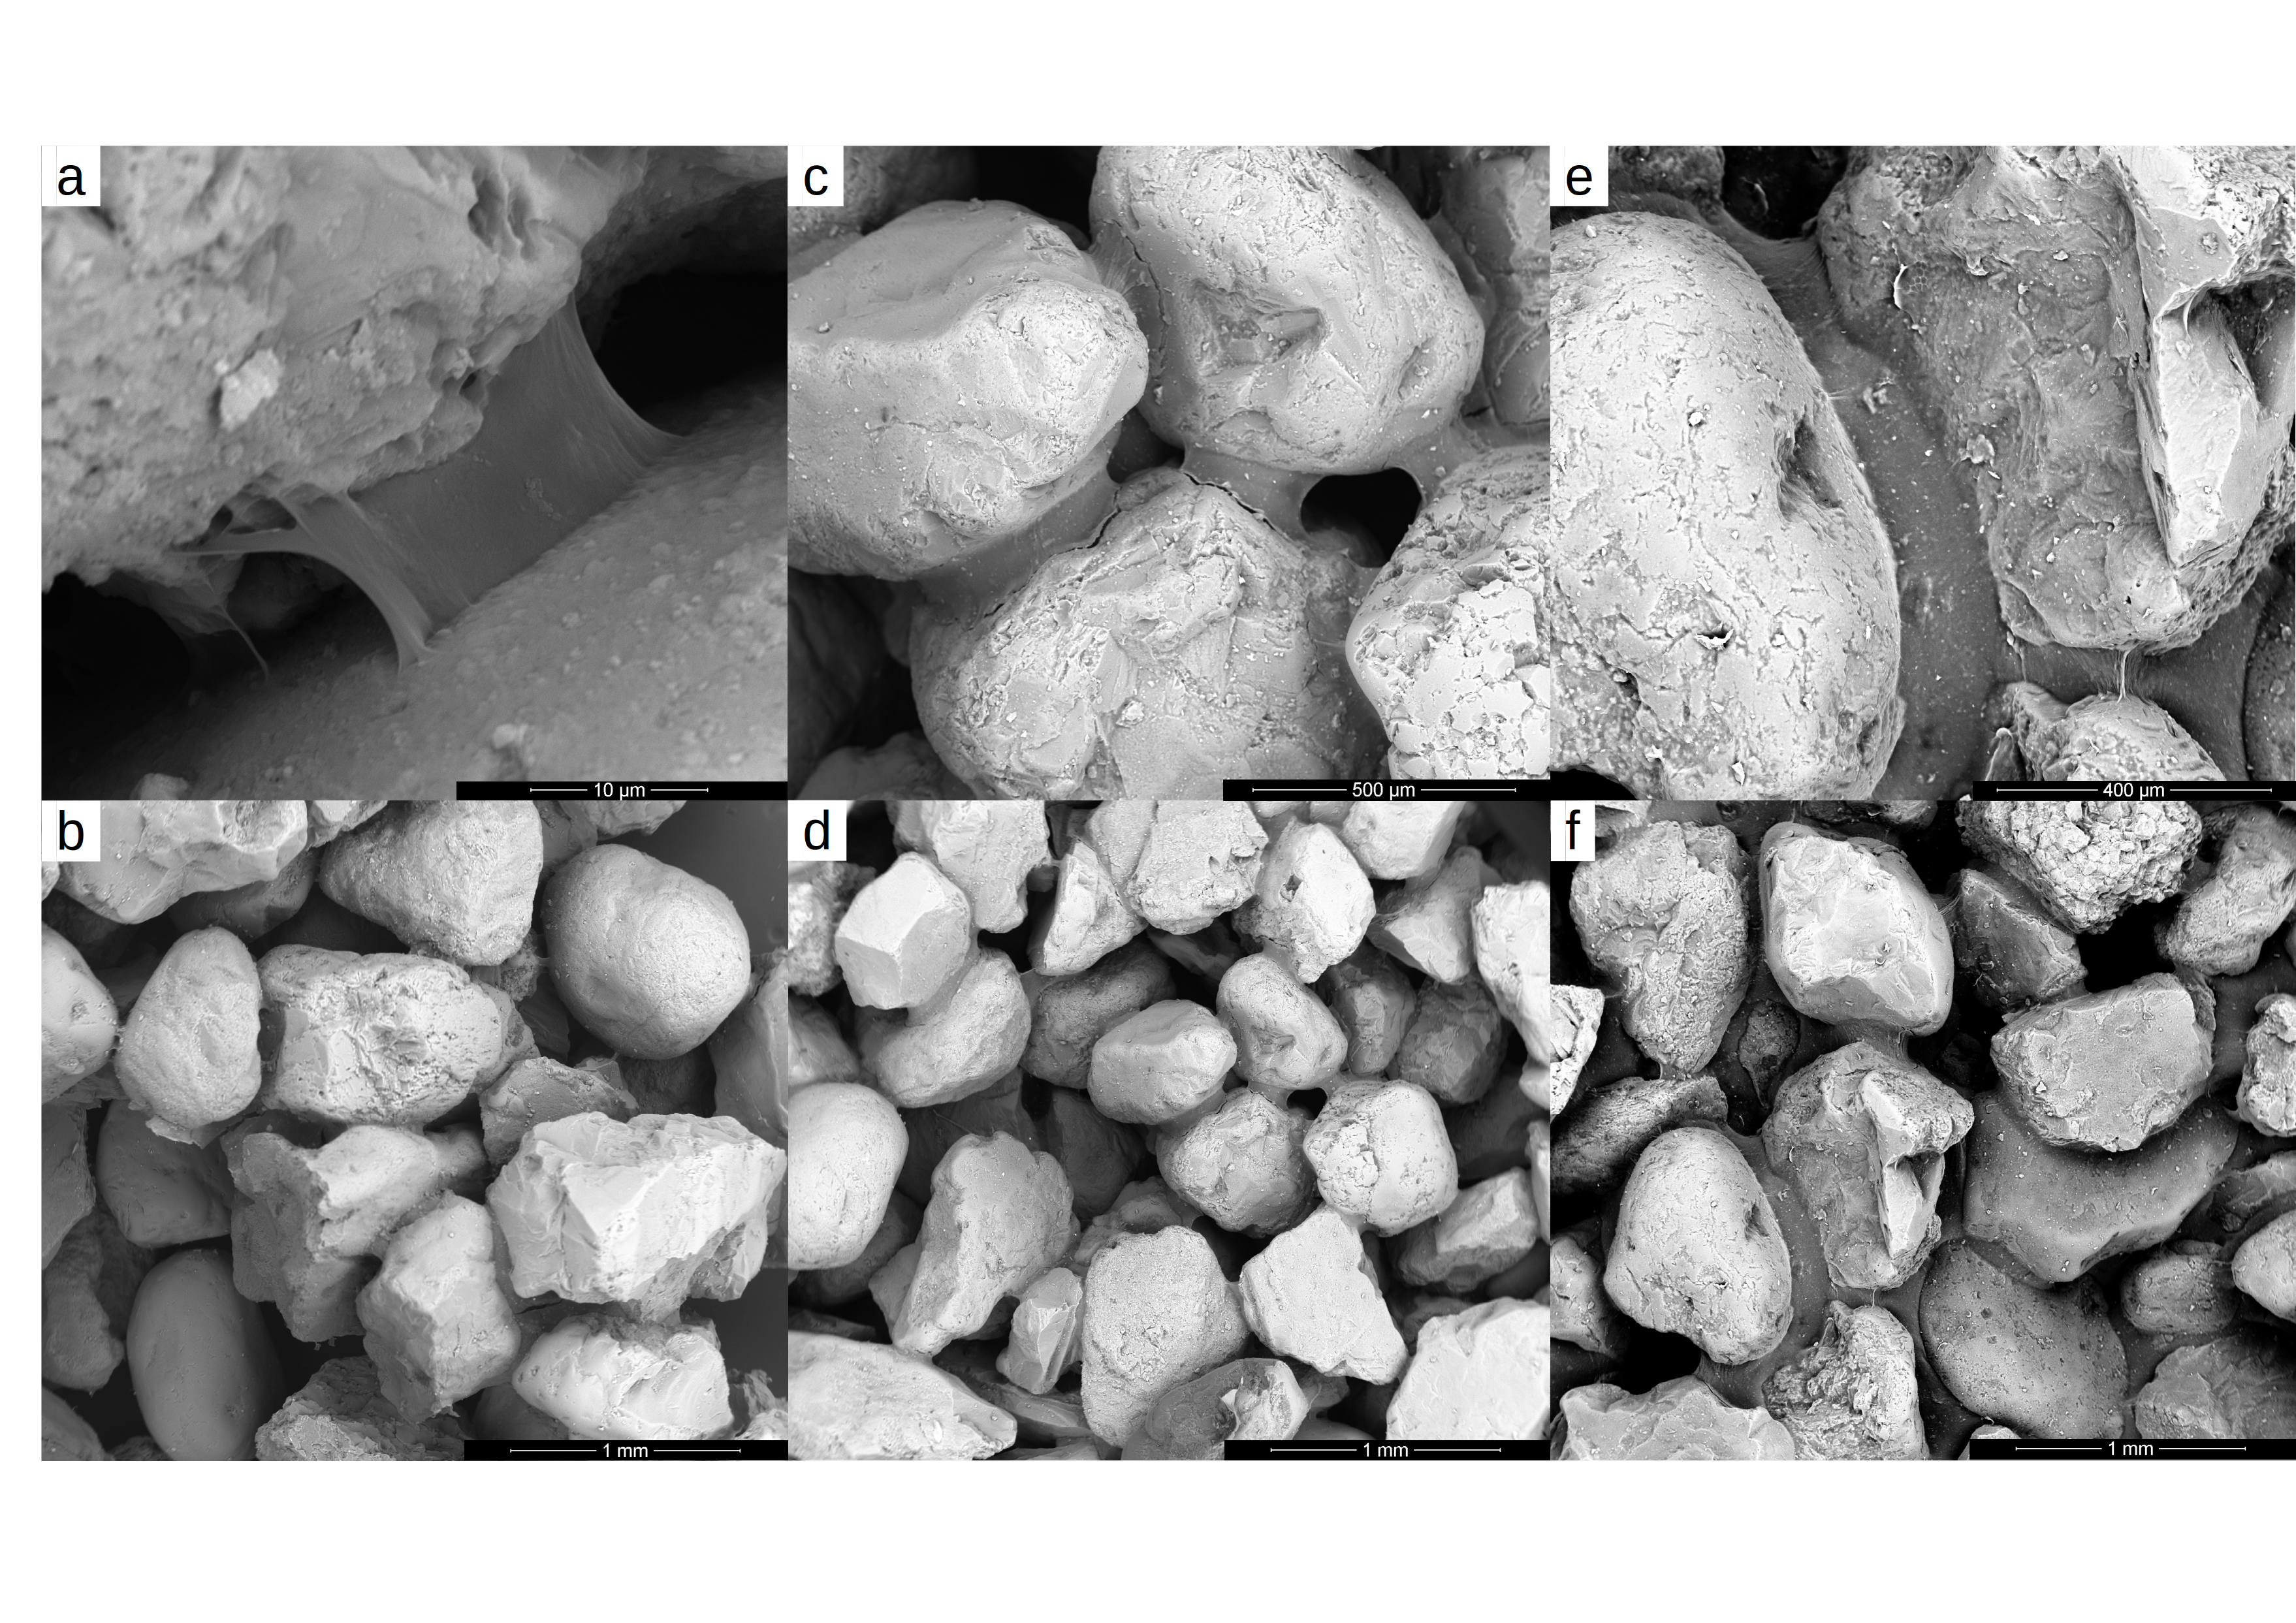
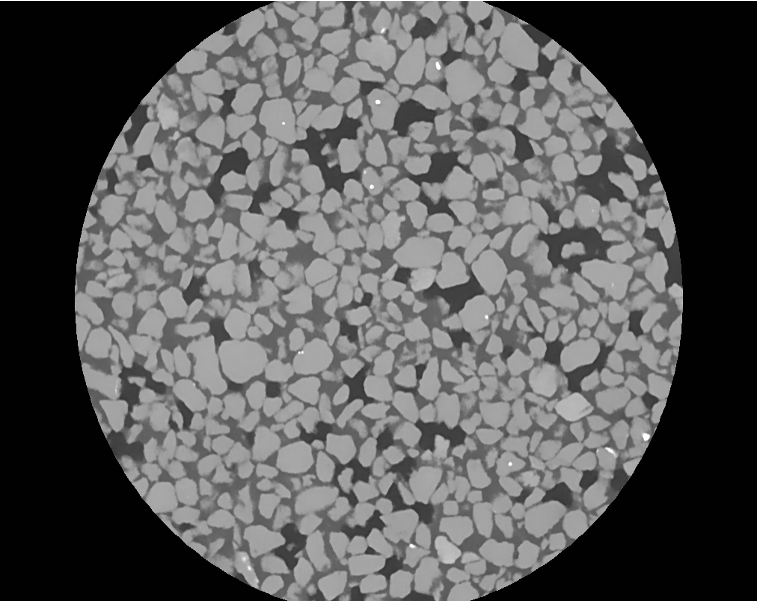
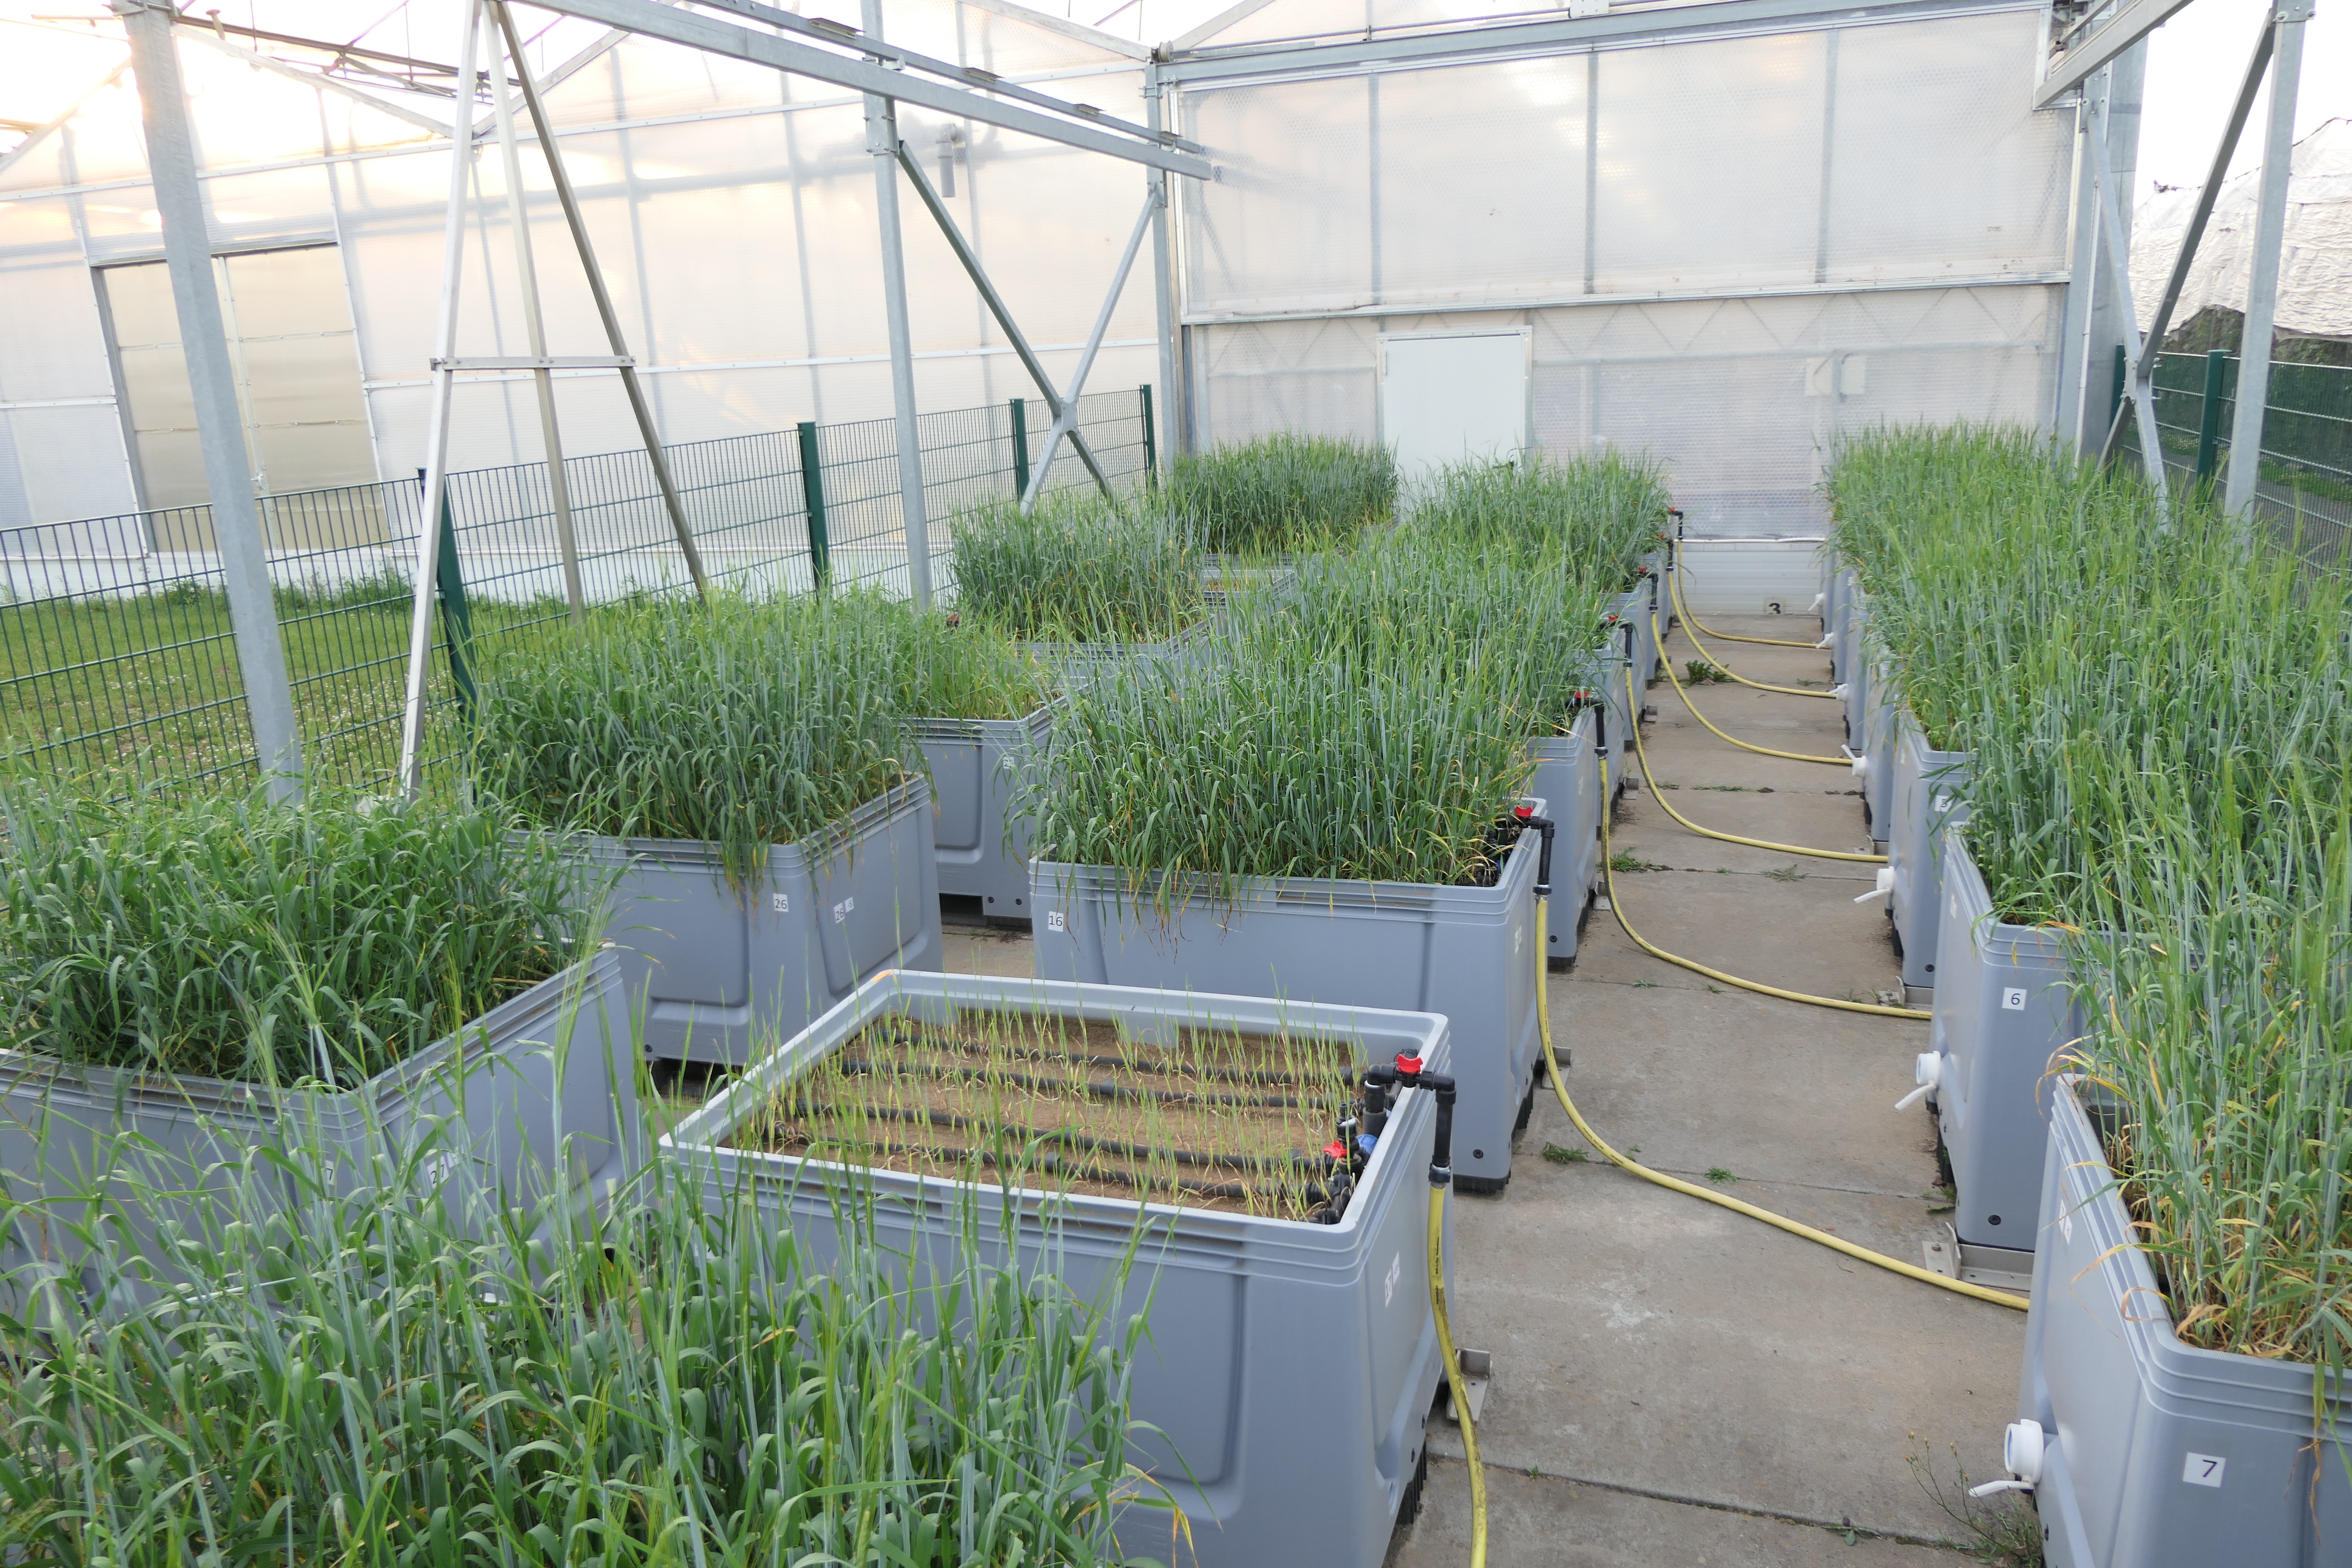
The effect of a mucilage analogue from chia seeds without intrinsic respiratory activity on oxygen diffusion was measured at different water contents during wetting-drying cycles in a diffusion chamber experiment. Artificial soils of various particle size distributions were mixed with various amounts of the mucilage analogue. Additionally, environmental scanning electron microscopy (ESEM) was used to visualize mucilage bridges in the dry soil samples.
-

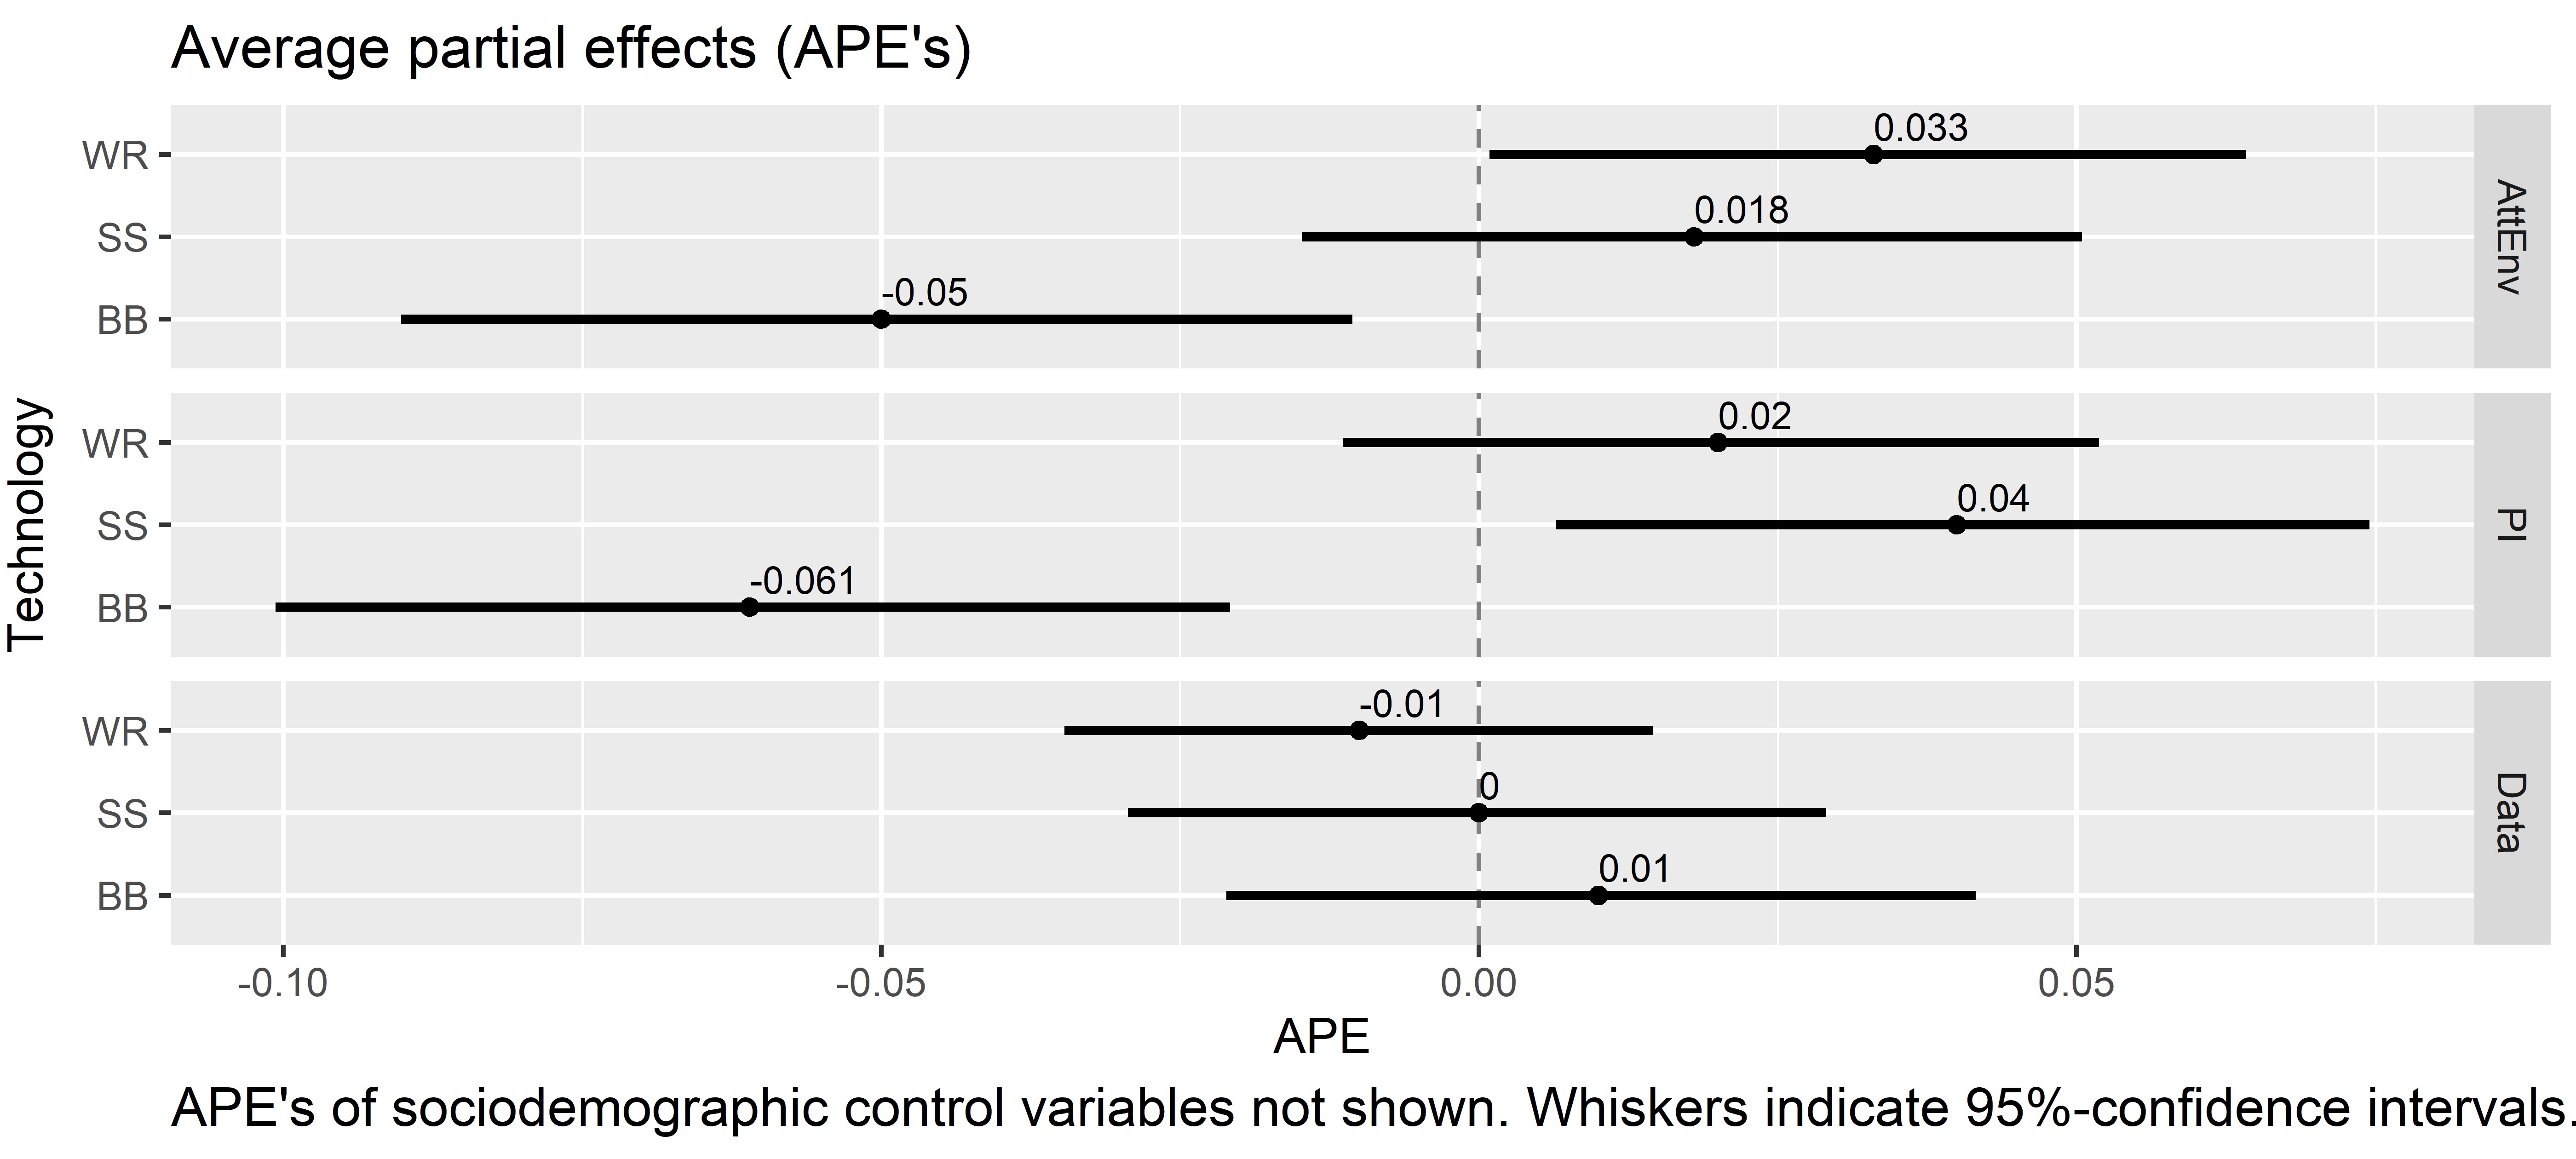
This data set contains online survey data from an experiment investigating German public attitudes towards agricultural robots. Major components are the data set containing 2,269 complete questionnaires (after data cleaning), the according Stata do-file to analyze the data and the output files from the preceding construct validity tests in SPSS.
-
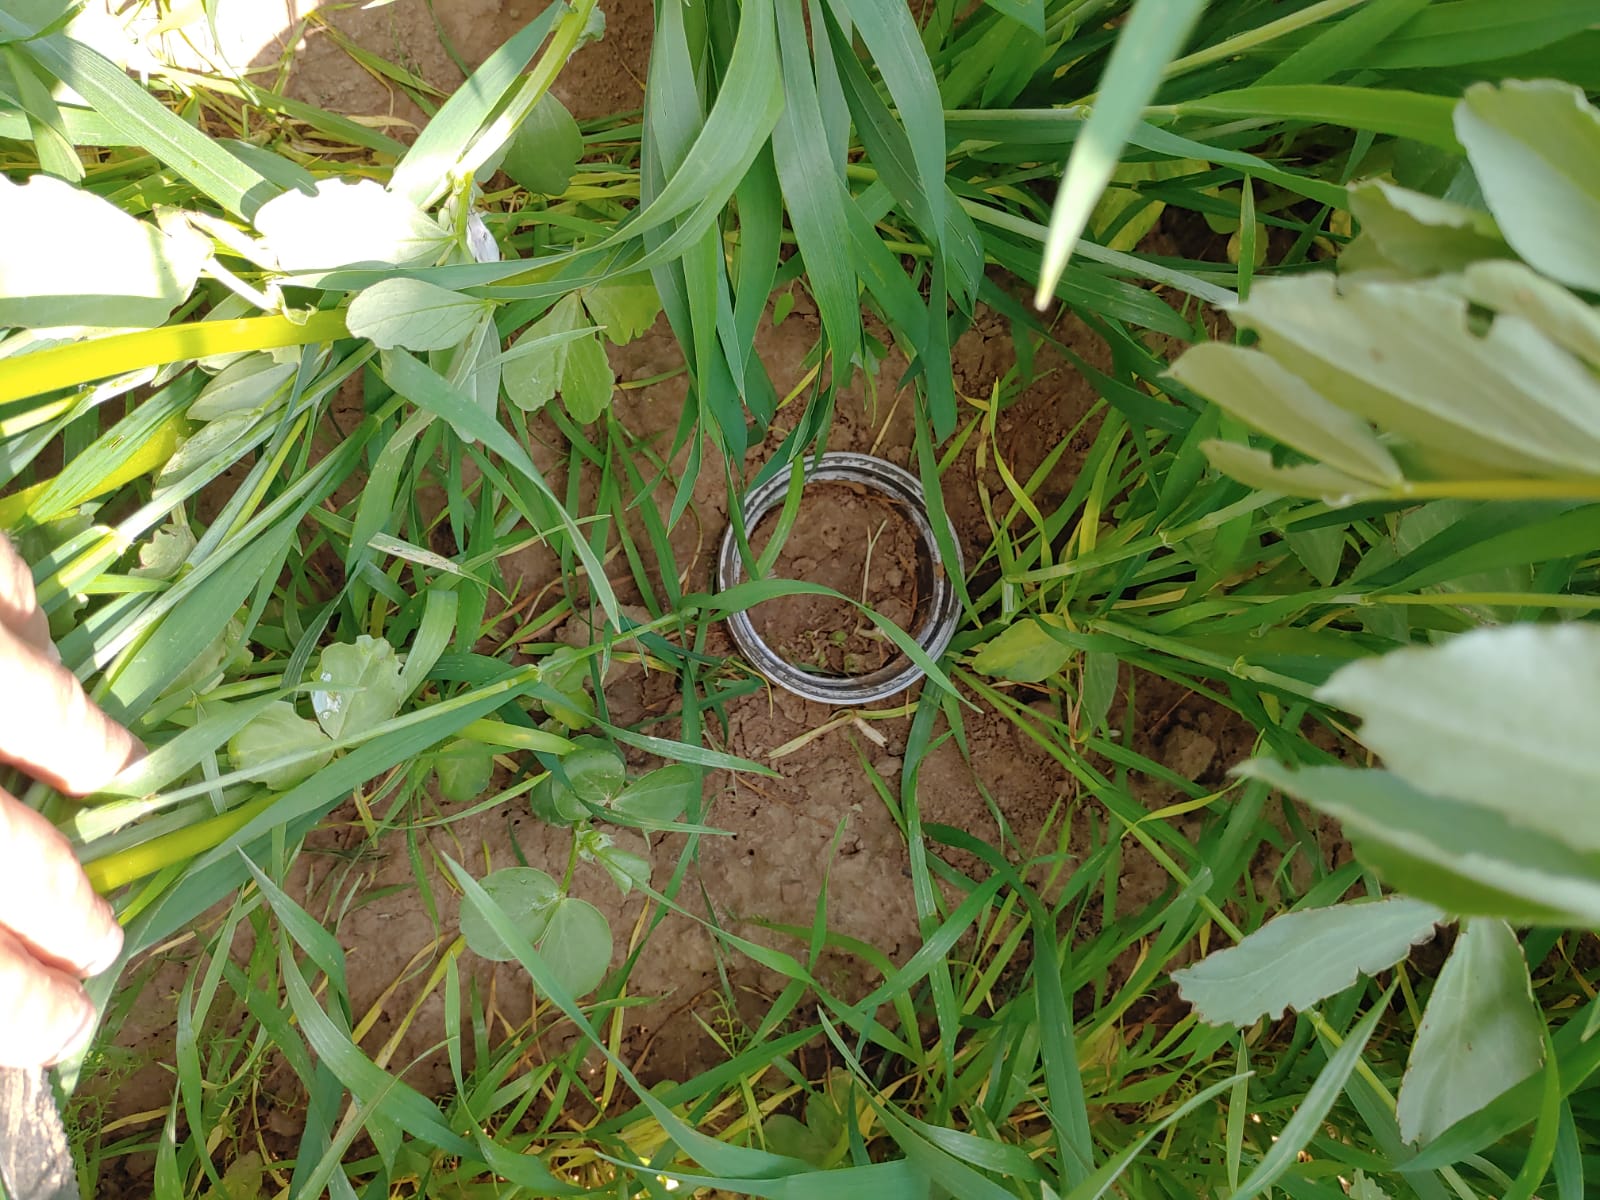
Data represent an intercropping field experiment carried out at CKA in the year 2021. Shoot and root data collection was conducted with one faba bean cultivar and two spring wheat cultivars sown at three sowing densities. FTIR spectroscopy was used to define the root masses of the two species.
-
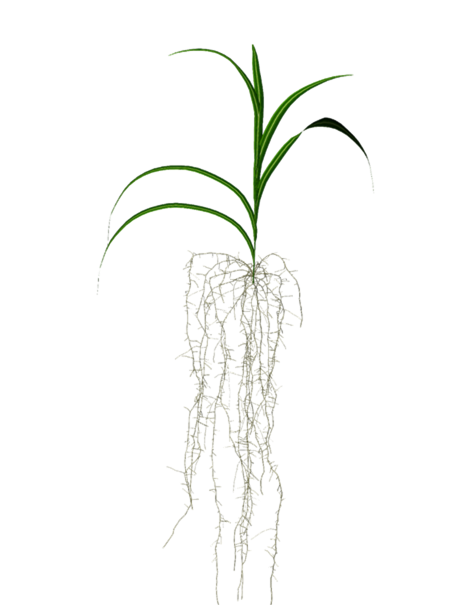
The global supply of phosphorus is decreasing. At the same time, climate change reduces the water availability in most regions of the world. Insights on how decreasing phosphorus availability influences plant architecture is crucial to understand its influence on plant functional properties, such as the root system’s water uptake capacity. In this study we investigated the structural and functional responses of \textit{Zea mays} to varying phosphorus fertilization levels focusing especially on the root system’s conductance. A rhizotron experiment with soils ranging from severe phosphorus deficiency to sufficiency was conducted. We measured architectural parameters of the whole plant and combined them with root hydraulic properties to simulate time-dependent root system conductance of growing plants under different phosphorus levels. We observed changes of the root system architecture, characterized by decreasing crown root elongation and reduced axial root radii with declining phosphorus availability. Modeling revealed that only plants with optimal phosphorus availability sustained a high root system conductance, while all other phosphorus levels led to a significantly lower root system conductance, both under light and severe phosphorus deficiency. We postulate that phosphorus deficiency initially enhances root system function for drought mitigation but eventually reduce biomass and impairs root development and water uptake in prolonged or severe cases of drought. Our results also highlight the fact that root system organization, rather than its total size, is critical to estimate important root functions.
-
The dataset RGB-MiniplotBarley contains 22164 RGB images of 11 time points 21. jun - 7. jul 2022 of two genotypes of spring barley grown under single-nutrient deficiencies of N, P, K, S, B and one multi-nutrient deficient treatment from miniplot fertilizer trial at Campus Klein-Altendorf of University of Bonn. The images are annotated with plot number, genotype and fertilizer management and have been taken for a Deep Learning approach for nutrient deficiency recognition.
-
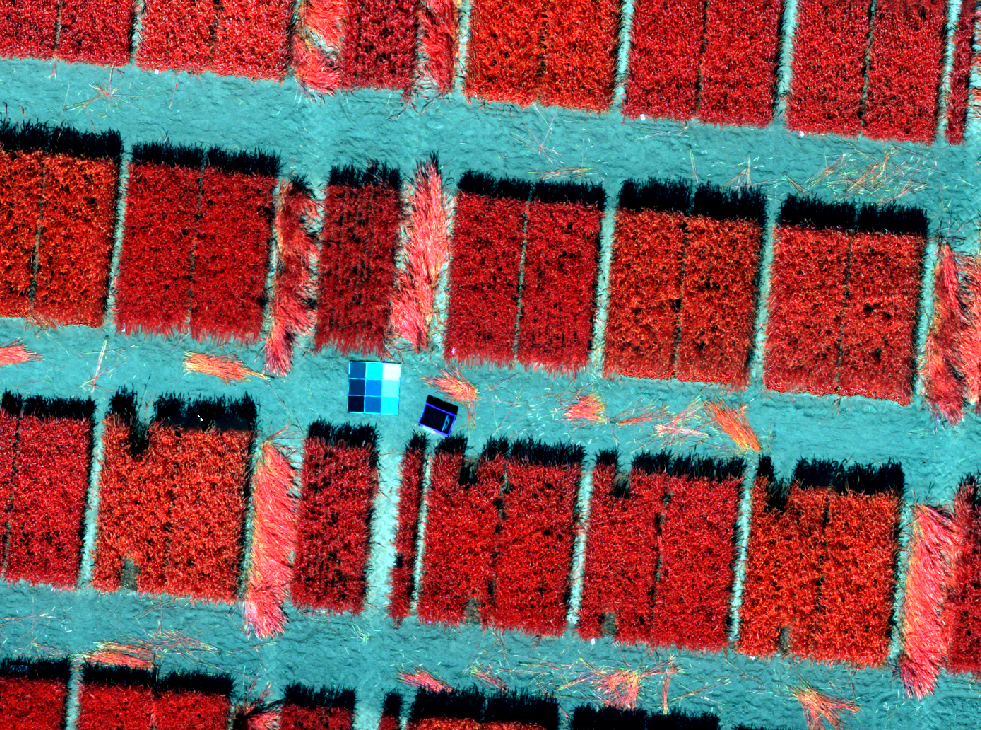
Reflectance orthomosaics of PhenoRob Central Experiment derived from 2021 multispectral image data.
-
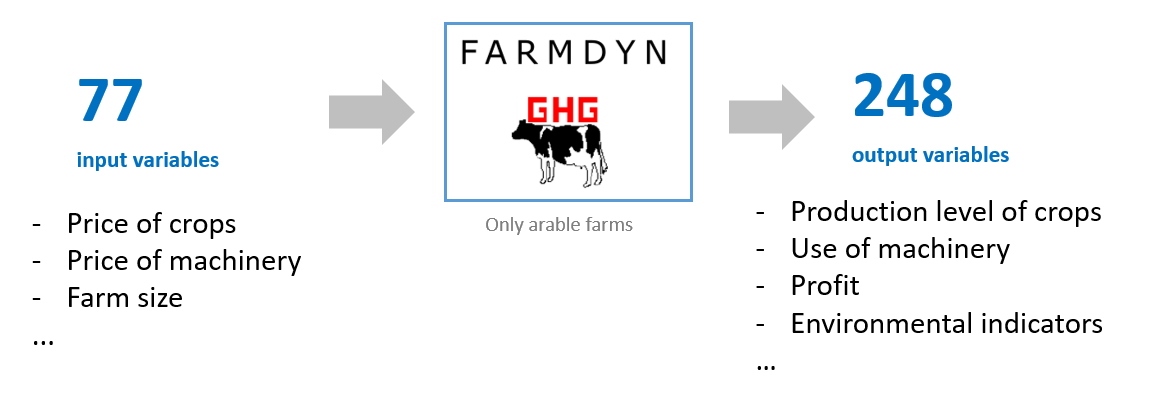
This data set is generated by the bio-economic farm-level model FarmDyn (https://farmdyn.github.io/documentation/). X_raw.parquet.gzip contains the input data (77 variables), and Y_raw.parquet.gzip contains the corresponding output data (248 output variables). A farm in FarmDyn maximizes its profit based on the what input values are given (e.g. crop prices, farm size, etc.). The output variables are either a farm's decisions of farming activites or the outcomes of its decisions. The data can be read in python by pd.read_parquet.
-
This data set contains survey data from a framed field experiment that was conducted with German crop farmers between February and April 2022. Major components of the data set: a set of psychographic/attitudinal items, results from an economic business simulation game, sociodemographic and farm structural variables (n=334 after data cleaning).